ions in solar flares
| la science |
| les supernovae |
| les novae |
| les objects compacts |
| les sursauts solaires |
| retour |
MAX's two energy ranges happen to be extraordinarily well suited for
this study. The lower range includes the positron-annihilation line,
whose Doppler profile is very sensitive to the temperature and density
of the plasma in which the positrons (produced by nuclear and pi-meson
decays) annihilate. The first high-resolution measurement of a solar
flare annihilation line was recently made by RHESSI (Share et al. 2003)
and the line turned out to be surprisingly broad (8.1+/-1.1 keV FWHM).
There are two possible scenarios for a line this broad: thermalization
in a very hot plasma (about 500,000K) or annihilation "in flight" in a
cooler plasma in a very narrow energy band of approximately 6000K +/- 500K.
In the quiet solar atmosphere, there is not enough solar material in either
state to stop and annihilate positrons, so we are being told something
very specific about the flaring atmosphere; but more data are needed to
know which atmosphere and annihilation mode is responsible. The broadened
line is confirmed in other RHESSI flares not yet published.
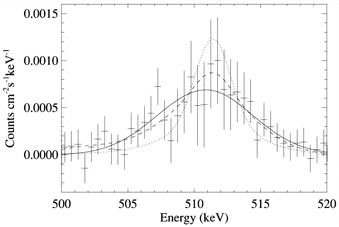
Fig 1 : Spectrum of the solar 511 keV annihilation line derived by subtracting the instrumental and background components from the total spectrum observed during the flare. The uncertainties are too large for the scatter in the data; therefore, we use the difference in chi-squared to compare the fits of different line shapes. The solid curve is the best-fitting Gaussian. The dashed curve showing the calculated line shape formed in a quiet atmosphere at 6000 K fits the data equally well. There is only a 1% probability that the line shape at 5000 K (dotted curve) fits as well (difference in chi-squared = 6.7). Figure from Share et al. 2003
A bright de-excitation line of iron is included in MAX's high energy channel, being in fact the same 847 keV transition MAX is designed to study in radioactive decay in supernovae. When the nuclear excited state is formed by collision of accelerated protons and alpha particles with a stable 56Fe nucleus, however, it decays in picoseconds, so that the Doppler shift of the line records the recoil of the nucleus from the original interaction. Thus the Doppler profile of the line contains information on the energy spectrum, the angular distribution, and the composition (protons versus alpha particles) of the accelerated flare ions. De-excitation line profiles at high resolution have been observed by RHESSI (Smith et al. 2003) and used to put some constraint on the angular distribution of accelerated particles, but more photons are needed to get full value out of the line; RHESSI has only 26 cm2 of effective area at 847 keV.
Finally, there is an exciting possibility of detecting 56Co radioactivity
in the solar atmosphere in the aftermath of a major flare (Ramaty and Mandzhavidze
2000). If this line is seen, its decay rate can be used to investigate
atmospheric mixing in active regions, a process difficult to study in any
other way. The line is expected to be faint, but extremely well-matched
to MAX's capabilities, since there is no flare continuum underneath it
to lower the sensitivity (the prompt de-excitation lines are extremely
bright but carry their own flare continuum background underneath them,
so that effective area becomes more important than background rejection).
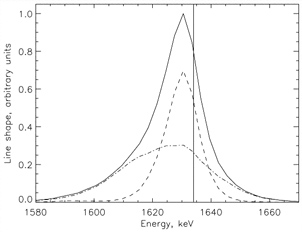
Fig. 2: Model 20Ne line shape for a power-law index of
-3.75, a viewing angle of 30°, and a forward-isotropic distribution.
Dashed curve: Line shape from interacting protons. Dash-dotted curve: Line
shape from interacting a-particles. Solid curve: Total line shape for an
a /proton ratio of 0.5. Vertical solid line: Rest energy of the de-excitation
line, 1634 keV. [Note: the Fe line is much narrower (a few keV) but could
still be resolved by a carefully made GeD]. Simulations by R. Murphy presented
in Smith et al. 2003
Most of the largest X-class flares, which produce copious gamma-ray
lines, occur from large, complicated active regions which often produce
several such flares as they cross the Solar surface. MAX could thus
be pointed at an active region which had proven itself capable, yielding
an excellent chance of a repeat performance within a few days. In
the meantime, smaller flares from the same region would allow MAX to test
the competing hypotheses that ions are accelerated to high energies only
in the largest flares, or that they are always present at some level when
electrons are accelerated. The next flare location could probably
be predicted to within one arcminute, and MAX would have to track the region
across the Solar surface, with pointing updates several times a day (either
automated or commanded).
Ramaty, R., & Mandzhavidze, N. 2000, in IAU Symp. 195, Highly
Energetic Physical Processes and Mechanisms for Emission from
Astrophysical Plasmas, ed. P. C. H. Martens, S. Tsuruta, & M. A.
Weber (San Francisco: ASP), 123
Share, G. H. et al. 2003, ApJL 595, L85
Smith, D. M. et al. 2003, ApJL 595, L81
mise à jour : mars 2004
questions et commentaires :Peter
von Ballmoos