Modelization of the HIREGS III Ge spectrometer background

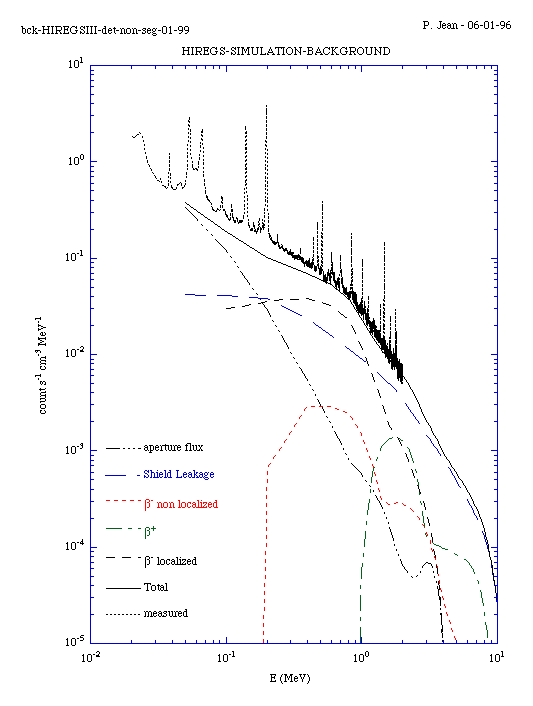
Observed and calculated background in the HIREGS unsegmented Ge detectors.
The data are from the flight 94-95 and the calculations are for the continuum
background. The beta decay components have been taken from Naya et al.
(1996, N.I.M, A368, 832) and scaled with the ratio of the rates in the
198 keV line between HIREGS and HEXAGONE II.The photonic components have
been estimated with Monte-Carlo simulations using the GEANT code.

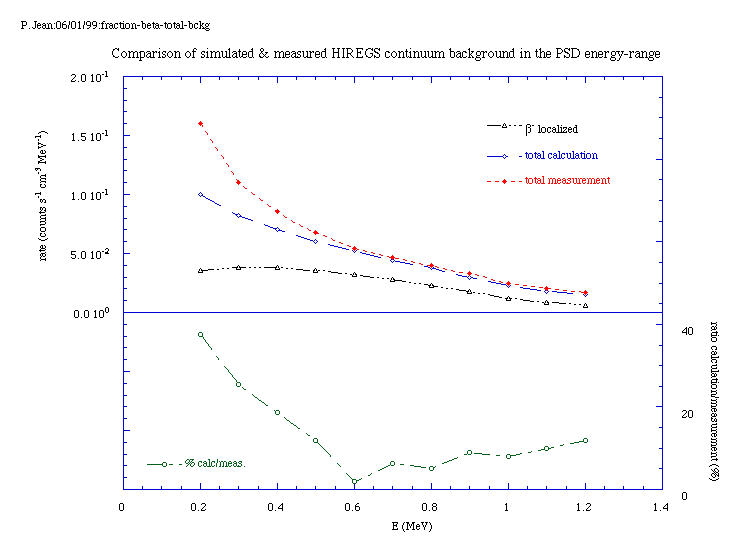
Comparison of the calculated and the observed continuum background of
HIREGS between 0.2 MeV and 1.2 MeV (PSD energy range). The estimated b-
localized component is also shown. The ratio between the calculation and
the measurement is presented in the bottom part. Numerical values are listed
in the table below

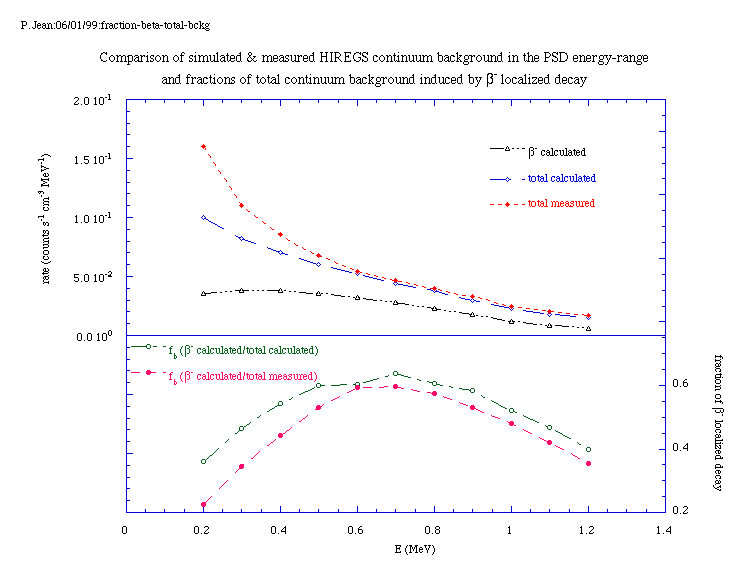
Estimations of the fraction of total continuum background rate induced
by b- localized decays. Two cases have been
considered: ratio between the calculated beta component
and total simulated continuum background, and, ratio
between the calculated beta component and total mesaured continuum background.
Numerical values are listed in the table below (the rates are in counts
s-1 cm-3 MeV-1).
|
|
|
|
|
|
|
|
|
|
|
|
|
|
|
|
|
|
|
|
|
|
|
|
|
|
|
|
|
|
|
|
|
|
|
|
|
|
|
|
|
|
|
|
|
|
|
|
|
|
|
|
|
|
|
|
|
|
|
|
|
|
|
|
|
|
|
|
|
|
|
|
|
|
|
|
|
|
|
|
|
|
|
|