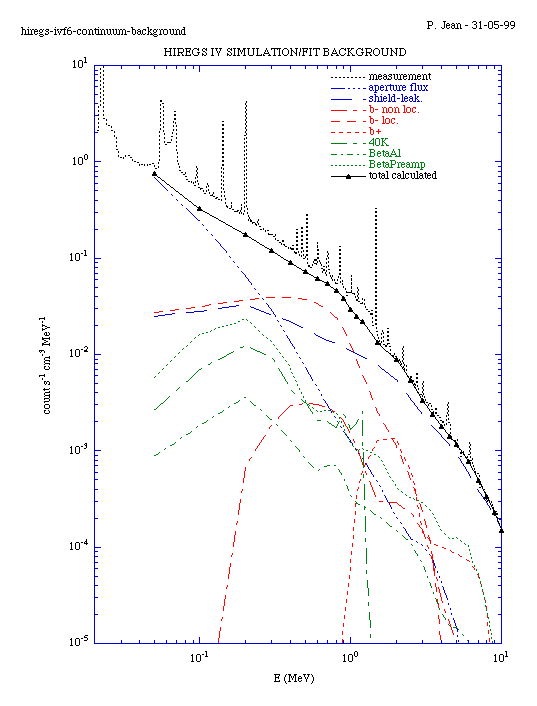
HIREGS IV Ge spectrometer continuum
background
Performance of the PSD
Data from Said Slassi at 5.8 g/cm2
PJ-2
The KCl radioactive sources in the spectrometer and the radioactive
decay emissivity of the Al and the preamplifier have been taken into account.

Total background spectrum of HIREGS - measurement and calculation. The
shield leakage component has been fitted in the high energy range (increase
of the component of a factor Å1.97 with respect to 3.5 g cm-2).
The Al and preamplifier emissivity has been calculated using GEANT/GCALOR
and ENSDF data for 3 days of irradiation.
PJ-3
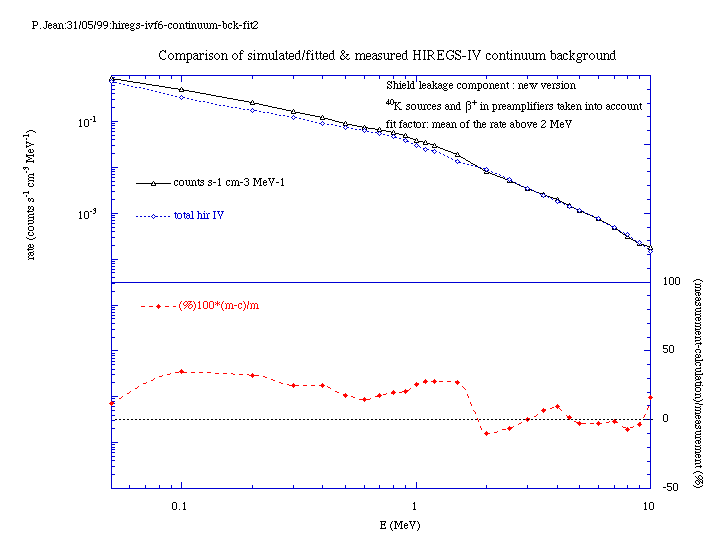
Comparison of the calculated and the modeled continuum background of
HIREGS IV (see previous figure). The differences between the model and
the measurement are also presented. Shield leakage component: fitting factor
(mean rate in the shield leakage energy range) 1.97.
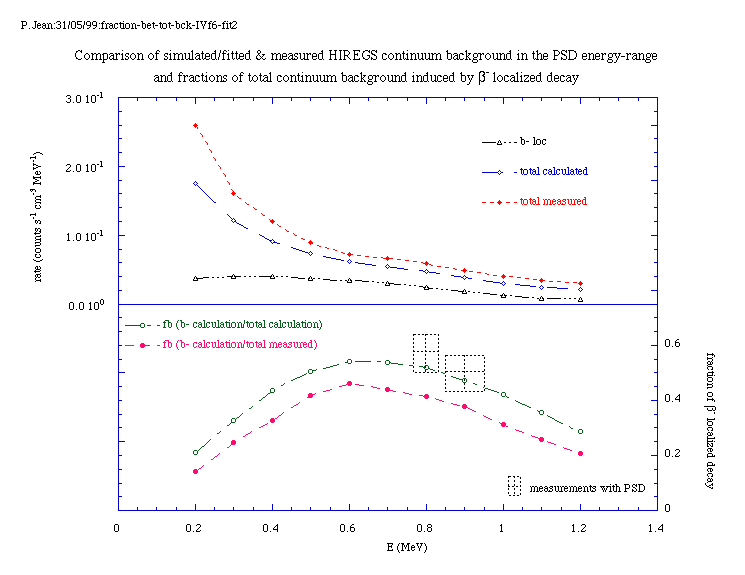
Estimations of the fraction of total continuum background rate induced by b- localized decays with the above background model. Two cases have been considered: ratio between the calculated beta component and total modeled continuum background, and, ratio between the calculated beta component and total measured continuum background.
Numerical values are listed below (the rates are in counts s-1 cm-3 MeV-1).
E (MeV) b- loc
tot-calc. tot-meas.
%c/m fb(b-/calc) fb (b-/meas)
2.000e-01 3.716e-02 1.756e-01 2.600e-01
32.5 2.117e-01 1.429e-01
3.000e-01 3.957e-02 1.215e-01 1.610e-01
24.5 3.257e-01 2.459e-01
4.000e-01 3.950e-02 9.073e-02 1.202e-01
24.5 4.353e-01 3.285e-01
5.000e-01 3.717e-02 7.350e-02 8.927e-02
17.7 5.058e-01 4.164e-01
6.000e-01 3.362e-02 6.202e-02 7.258e-02
14.6 5.421e-01 4.632e-01
7.000e-01 2.931e-02 5.458e-02 6.651e-02
17.9 5.369e-01 4.406e-01
8.000e-01 2.423e-02 4.676e-02 5.829e-02
19.8 5.183e-01 4.158e-01
9.000e-01 1.825e-02 3.851e-02 4.840e-02
20.4 4.739e-01 3.771e-01
1.000e+0 1.236e-02 2.938e-02
3.943e-02 25.5 4.208e-01 3.135e-01
1.100e+0 8.754e-03 2.460e-02
3.404e-02 27.7 3.559e-01 2.572e-01
1.200e+0 6.272e-03 2.188e-02
3.029e-02 27.8 2.866e-01 2.070e-01
PJ-4
PJ-5
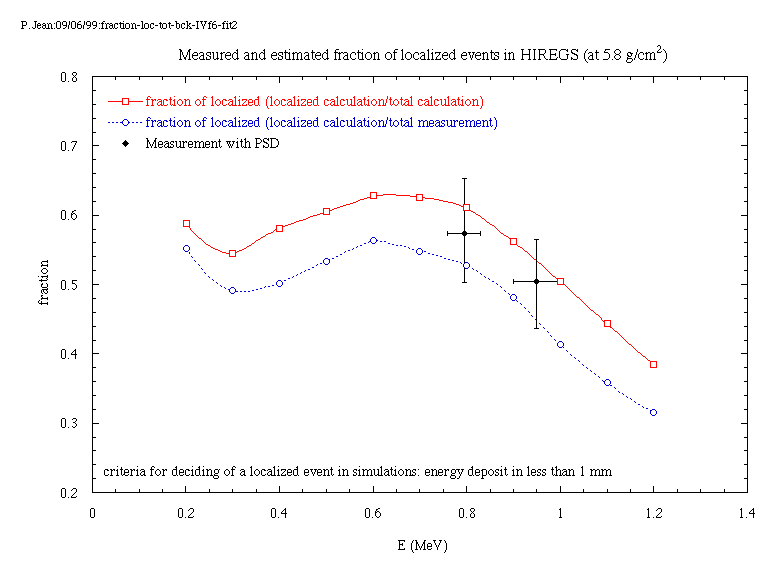
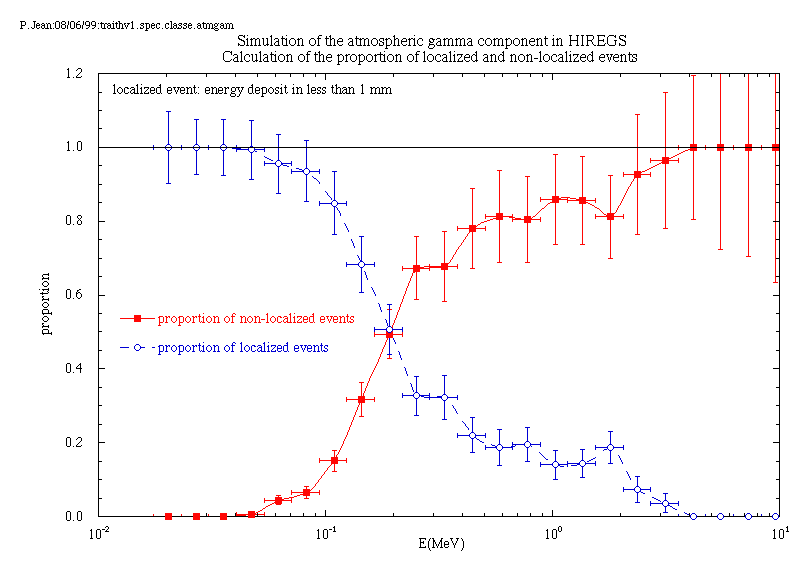
Estimations of the fraction of total continuum background rate induced by localized events with the current background model. Two cases have been considered: ratio between the calculated localized component and total modeled continuum background, and, ratio between the calculated and measured localized component and total measured continuum background.
Numerical values are listed below (the rates are in counts s-1 cm-3 MeV-1).
E (MeV) b- loc
tot-calc. tot-meas.
%c/m f_l(/calc) f_l (/meas) f_l(gamma)
2.000e-01 3.716e-02 1.756e-01 2.600e-01
32.5 5.881e-01 5.521e-01 4.774e-01
3.000e-01 3.957e-02 1.215e-01 1.610e-01
24.5 5.449e-01 4.910e-01 3.251e-01
4.000e-01 3.950e-02 9.073e-02 1.202e-01
24.5 5.815e-01 5.023e-01 2.588e-01
5.000e-01 3.717e-02 7.350e-02 8.927e-02
17.7 6.052e-01 5.338e-01 2.012e-01
6.000e-01 3.362e-02 6.202e-02 7.258e-02
14.6 6.278e-01 5.636e-01 1.871e-01
7.000e-01 2.931e-02 5.458e-02 6.651e-02
17.9 6.261e-01 5.484e-01 1.927e-01
8.000e-01 2.423e-02 4.676e-02 5.829e-02
19.8 6.106e-01 5.277e-01 1.917e-01
9.000e-01 1.825e-02 3.851e-02 4.840e-02
20.4 5.621e-01 4.815e-01 1.677e-01
1.000e+0 1.236e-02 2.938e-02
3.943e-02 25.5 5.047e-01 4.130e-01
1.449e-01
1.100e+0 8.754e-03 2.460e-02
3.404e-02 27.7 4.435e-01 3.582e-01
1.360e-01
1.200e+0 6.272e-03 2.188e-02
3.029e-02 27.8 3.842e-01 3.155e-01
1.368e-01