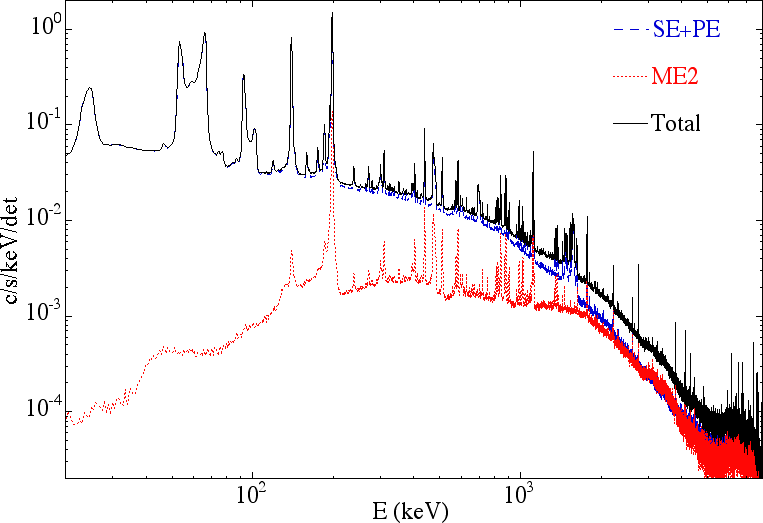
SPI background characteristics

Fig: Average SPI background spectrum. Single detector event (SE+PE)
and double detector event ME2 spectra are presented separately.
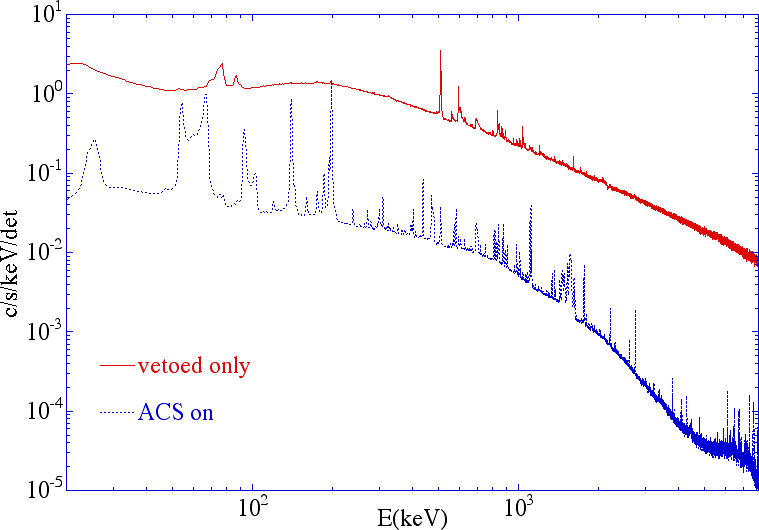
Fig: SPI background spectra of Ge detector events in anticoincidence
with an event in the ACS ("ACS on") and in coincidence with an event in
the ACS ("vetoed only").
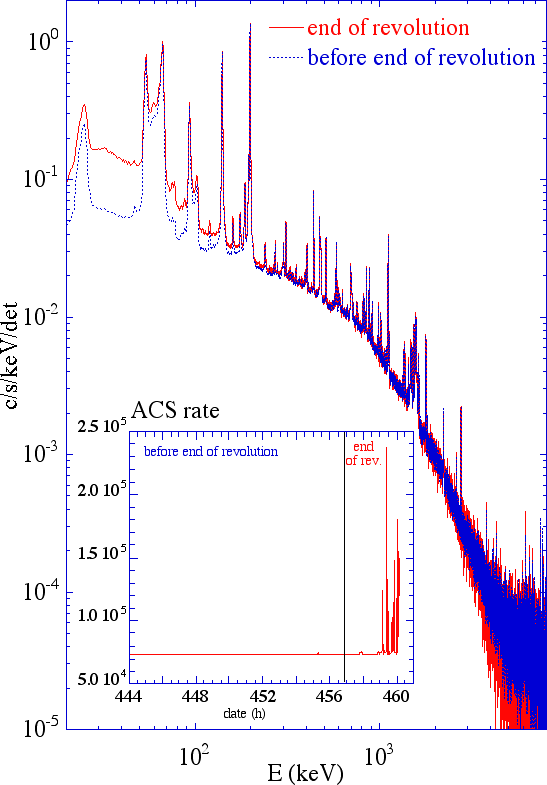
Fig: Spectrum before and during the end of revolution. ACS rate as a
function of time is also shown.
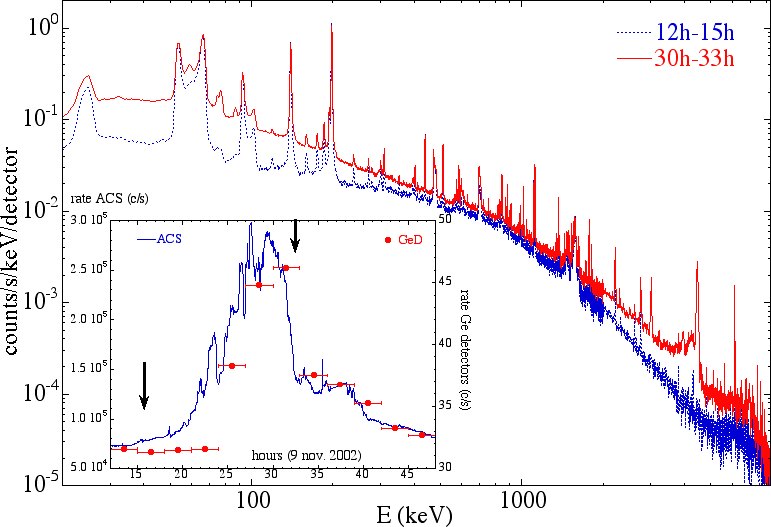
Fig: Spectrum before and at the maximum GeD rate during the solar flare
of november 9., 2002. ACS and Ge detector rates as a function of time are
also shown.
Variation of the background rate across the detector plane
Distribution of the massique rate of single detector events (c/s/g) using empty field data.
IBIS is on the left side.
Numberage: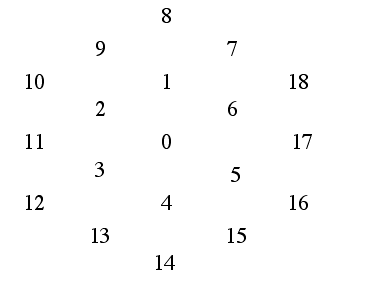
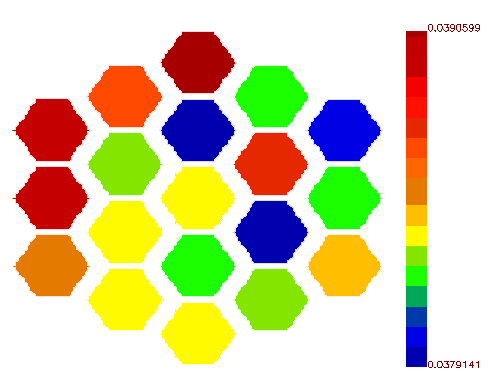 Fig:
20keV-8000keV
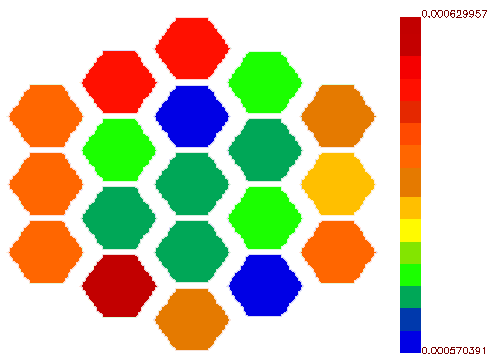 Fig: 25keV
"line"
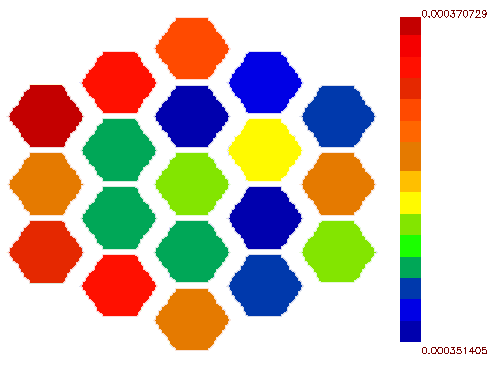 Fig:
228keV continuum
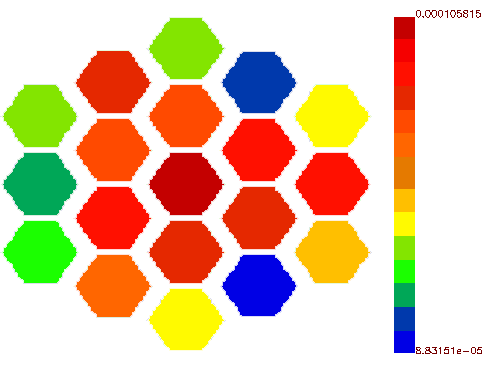 Fig:
511keV line
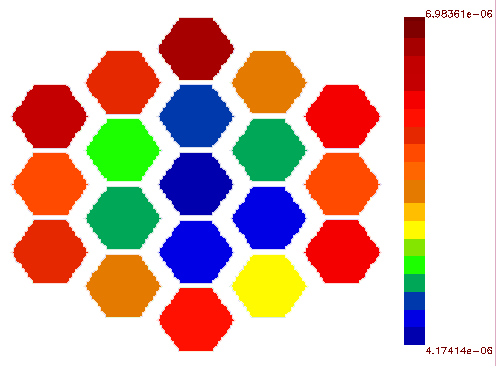 Fig:
2223keV line
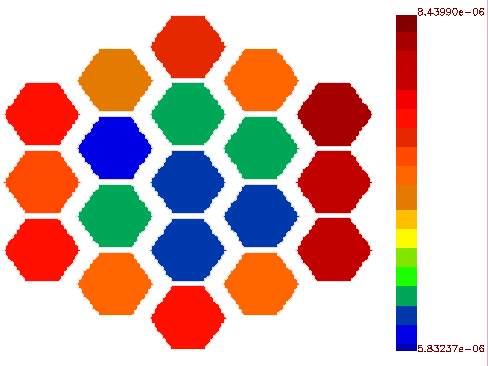 Fig:
5750keV continuum