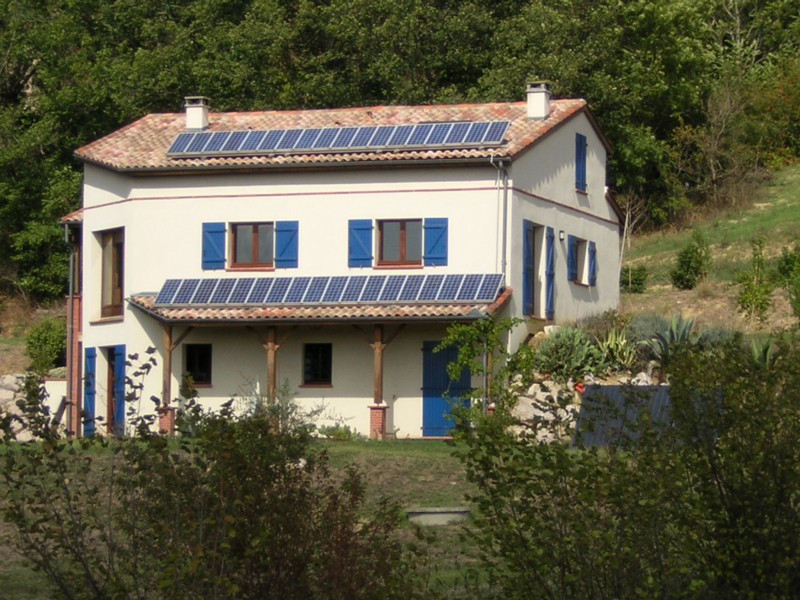
A grid-tied PV array site.
The PV panels are on the roofs. Additional domestic hot water solar panels can be seen on the ground at the right of the house.
Make your own solar electricity, use it and sell it!
Excel spreadsheet showing the monthly PV power production since 1996, and financial data. Ccomments are in French, but the data is easily understandable.
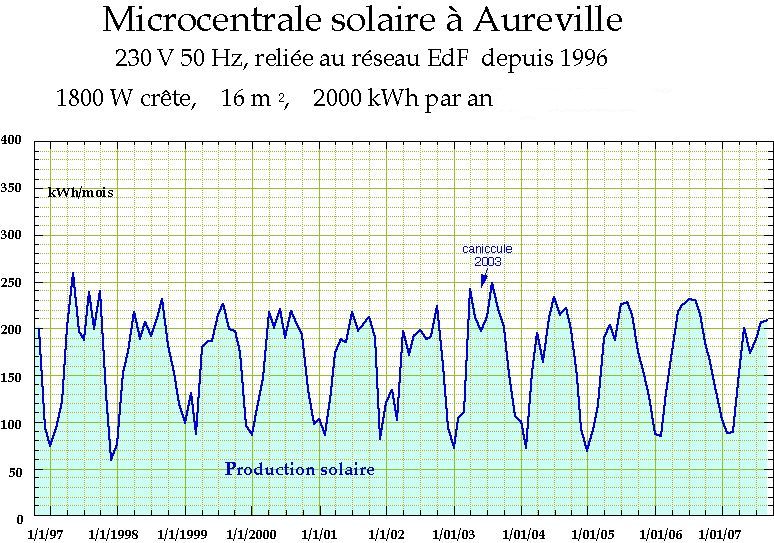
Plot of the monthlly power production for 10 years
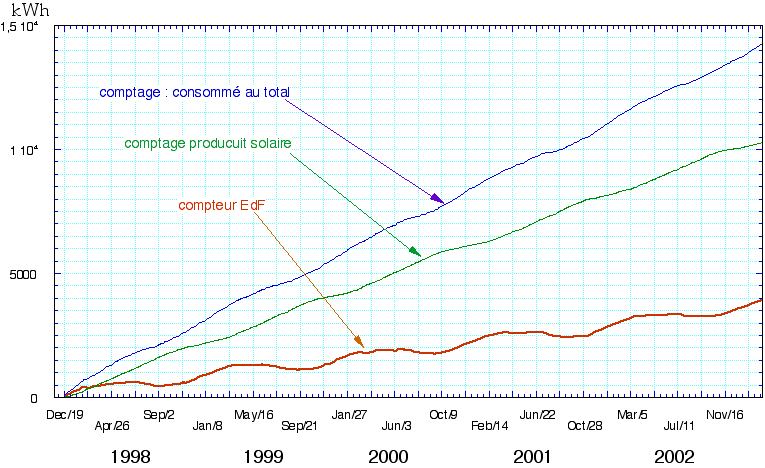
Monthly since october 1996. The solar PV production covers 75% of the annual
electricity needs of the household. However, in summer we feed power to
the grid : see the green and red lines on the graph, resp. PV production
and power use. Only the production data is recorded during the first year
: at the time the house was not built and the array was operating in a nearby
site.
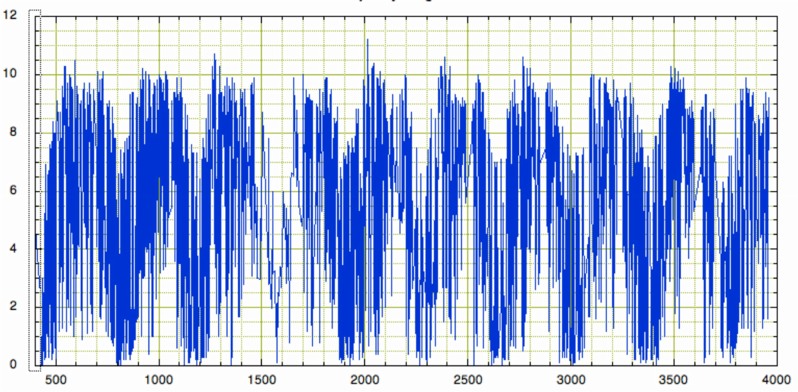
Per day plot
Plot of the daily PV production for ten years. The data is normally recorded
every day, except in winter 2000 where it is sparse. One can notice the daily
fluctuations, the sesonal changes, a peak production of 11.3 kWh in one clear,
cold and windy day in spring 2002, and the loss of power due to too much
heat in summer.
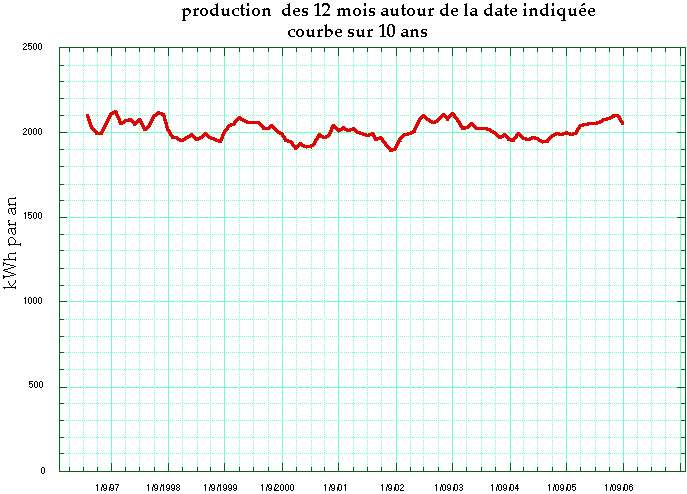
Evolution of the summed 12-month production The global efficiency of the array seems to be very stable over the years : only 1% decrease per year, although it may be too soon to draw conclusions after six years only.
Plot of the meters over six years.
Hespul The reference site for Solar Grid-tied in France
bdpv.fr Solar Grid-tied PV in Europe : an innovative data base !
Home Power magazine A good US magazine